Werner13.Other
Reading: BASIC RATEMAKING, Fifth Edition, May 2016, Geoff Werner, FCAS, MAAA & Claudine Modlin, FCAS, MAAA Willis Towers Watson
Chapter 13: Other Considerations
Contents
- 1 Pop Quiz
- 2 Study Tips
- 3 BattleTable
- 4 In Plain English!
- 5 POP QUIZ ANSWERS
Pop Quiz
How many claims are required for full credibility if we want a 95% probability that our estimate is within 10% of the true value. Values of 95% and 97.5% on the normal distribution curve correspond to standard deviations of 1.645 and 1.96 respectively. Click for Answer
Study Tips
VIDEO: W-13 (001) Other Considerations → 5:00 Forum
Good news: Most of this chapter is easy-breezy. :-)
The full title of this chapter is "Other Considerations". That refers to things like marketing considerations in addition to the normal rate change calculations when setting final rates. This chapter will make sense to you after reading through the wiki article once or twice. There are a few things you have to memorize as well as a couple of types of calculation problems but they are relatively easy.
Estimated study time: 1 day (not including subsequent review)
BattleTable
Based on past exams, the main things you need to know (in rough order of importance) are:
- lifetime value analysis - the 2017 problem is outdated but the 2013 problem is something you can do based on the current syllabus
- non-pricing solutions - balancing FIE (Fundamental Insurance Equation)
Outdated → questions highlighted in orange are outdated because they are from readings no longer on the syllabus
reference part (a) part (b) part (c) part (d) E (2019.Fall #8) maximize profit 1
- select rate changeevaluate change
- using SOP.RatemakingE (2019.Spring #8) expected profit
- calculateevaluate strategies
- on expected profitE (2019.Spring #12) recommend rate change
- consider mgmt targetsadverse selection
- caused by rate changenon-pricing solutions
- to balance FIE *E (2018.Fall #8) rate change
- identify consequencesrenewal probability
- identify factorsnon-pricing solutions
- to maintain profitabilitycompany comparison
- issues & solutions(2018.Spring #9) Excel Practice Problems E (2017.Fall #8) lifetime value analysis
- new business premiumjustify lifetime value
- using SOP.RatemakingE (2016.Fall #13) Werner09.RiskClass Werner09.RiskClass deviation from indicated
- from proposedE (2015.Fall #8) COR = 125% +
- long-term profitabilityE (2014.Fall #12) asset-share pricing
- vs pure premium modelasset-share pricing
- persistency assumptionasset-share pricing
- evaluate resultsE (2013.Spring #10) lifetime value analysis
- calculatelifetime value analysis
- unique considerations
- 1 There is an small error in the examiner's report solution. It's essentially correct but they state that the second rate change option is 2.5% when it should be 5.0%. (All of the sample solutions correctly use 5.0% in the calculations.)
- * FIE stands for Fundamental Insurance Equation.
- + COR stands for Combined Operation Ratio. Click Formulas - Pricing to review formula. To go to a quiz for calculation practice, click calculation practice and review BattleCards #4 & #5.
In Plain English!
In this chapter, we explore considerations other than cost-based rate indications to determine what rates to charge in practice. These other considerations and/or constraints, are:
- Regulatory constraints
- Operational constraints
- Marketing considerations
Super-dumb memory trick: There is ROM at the inn for other considerations. 😏
Regulatory Constraints
Regulation is generally handled by the individual states through state law and state regulatory agencies. The amount of regulatory scrutiny can vary significantly by jurisdiction and product. Lines of business such as personal auto and WC are highly regulated because financial compensation due to a car accident and employee welfare are very important. Certain types of commercial insurance such as directors and officers insurance are less heavily regulated. Regulation is lower for non-compulsory lines of insurance and where buyers are generally more sophisticated.
The regulatory process normally requires insurers to file manual rates with the appropriate regulatory body. In the U.S. this would be the state insurance department. Some jurisdictions and lines of business require prior approval of rates. Requirements for other jurisdictions and lines may more relaxed and require only filing before using (file and use) while still others may permit use of rates even before filing (use and file.)
Question: identify examples of regulatory constraints
- maximum overall % rate change for personal auto book of business
- maximum individual % rate change for personal auto customer
- must provide written notice to all customers if % rate change is greater than a specified amount (extra cost is such a pain, so insurers make sure they're under the limit)
- prohibit certain rating variables such as credit (even if the rating variable is predictive of loss costs)
- require that certain ratemaking methods are used (Ex: multivariate methods when using credit score as a rating variable)
- disagree with regulator on methods, LDF selections, trend selections
An insurer must comply with regulations but an insurer has options for how to deal with them. Side note: Something you may have noticed before is that I sometimes underline the key word in each bullet point. This really seems to help Ian-the-Intern because if he can recall the underlined word, that's usually enough of a prompt for him to be able to recall the whole phrase.
Question: identify actions an insurer can take with respect to regulatory constraints
- challenge a regulation legally
- revise U/W guidelines (to limit business segments where rates are inadequate due to regulatory constraints)
- revise marketing directives (to limit business segments where rates are inadequate due to regulatory constraints)
- substitute a similar rating variable in place of a banned variable (Ex: use payment history instead of credit score)
Actuarial work involves a lot more than crunching numbers. It's actually quite an interesting and complex challenge and requires a good dose of out-of-the-box creative thinking.
Operational Constraints
Sometimes an insurer encounters difficulties implementing a specific rate change because of operational constraints. This could be due to staffing issues or systems limitations, especially if a change to the rating algorithm is being considered. There's a very nice, very simple example from Werner of a cost-benefit analysis. I've reproduced it below:
| Example from Werner: Cost-benefit analysis |
- Assume a ratemaking analysis identifies that a risk characteristic accounts for a 10% difference in projected ultimate losses and expenses between Class A and Class B.
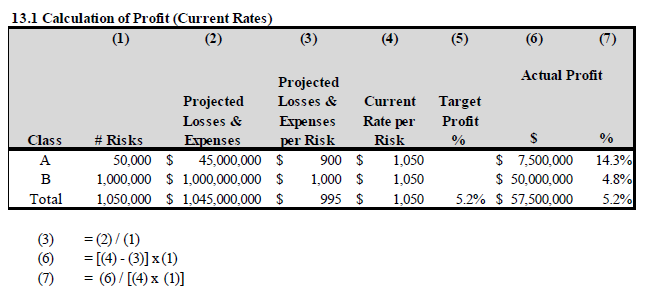
- The characteristic is not currently reflected in the rates; consequently, both classes are charged a rate of $1,050. (The target profit provision is 5.2%.)
- Using the current average rate, Class A risks will be more profitable than Class B risks.
- Table 13.1 below shows the profit calculation.
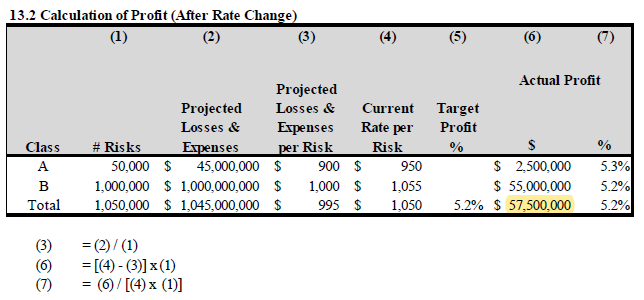
- If the rating variable is implemented, the company can decrease the rate for Class A and increase the rate for Class B in line with the difference in expected costs. In other words, instead of charging $1,050 for all risks, Refined Company can charge Class A risks $950 and Class B risks $1,055. Assuming no change in the risks insured, there will be no change in the total profit but the cross-subsidy will be eliminated. This can be seen in Table 13.2.
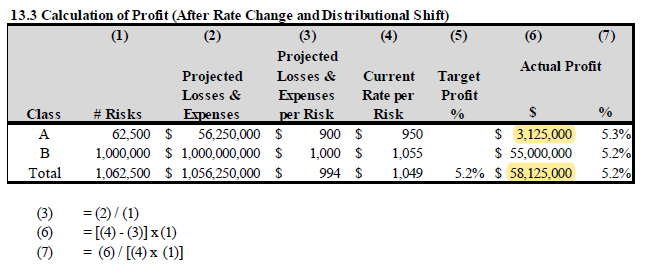
If this action is taken, the company will likely write more Class A risks and possibly fewer Class B risks. Assuming the change results in 25% more Class A business and no change in Class B business, the profit projections are as follows:
- The assumed distributional shift increased profits by:
- 58,125,000 – 57,500,500 = 625,000
The cost of implementing this change is not provided but if it's less than 625,000 then you would consider implementing the change. If the cost is greater 625,000 then you would likely not implement the change.
Here are a couple of pretty easy exam problems for you to try that are similar to the example above:
These exam problems are included in this quiz so you can record that you've done them.
Marketing Constraints
Intro
Traditional actuarial methods from prior chapters set prices to cover costs and achieve a specified target U/W profit. They implicitly assume that the number of policies is fixed and does not depend on price. In other words, everyone existing customer will renew their policy regardless of a rate increase. Of course, this isn't true in the real world. As price increases, demand for a product typically goes down and this effect should be taken into account when determining the selling price. This is a marketing consideration.
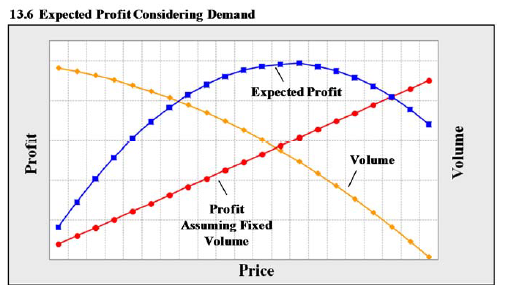
Here is a graph that appears in the first chapter of pretty much any economics textbook.
If the number of policies were fixed then profit (red line) would increase as price increases. The problem however, is that demand (yellow line) decreases as price increases. This means that the expected profit (blue line) reaches a maximum where the red and yellow lines cross. Therefore increasing the price beyond that point will lower demand and cause overall profits to go down. This effect of price on demand
Insurers often categorize insureds into new and renewal business. The is because the purchasing behavior and expected profitability of each group is different.
Question: identify factors that affect an insured's propensity to renew an existing product or purchase a new product are
- price of competing products
- - are competitor's offering a lower, more attractive price?
- overall cost of product
- - if cost is low then customers are less likely to shop around
- rate changes
- - big rate changes are annoying and may cause customers to shop around
- characteristics of insured
- - a young driver may be sensitive to price whereas a large commercial insured may be less sensitive
- customer satisfaction & brand loyalty
- - poor claims handling & bad customer service may decrease customer satisfaction and cause customers to shop around
- - a bowl of candy at the front desk of your insurance agent may increase customer satisfaction :-)
These factors are more relevant for lines like personal auto versus large commercial lines insurance purchasers. There is much more choice for personal auto than for large commercial policies so marketing considerations are generally more important for personal auto.
Traditional Techniques for Incorporating Marketing Considerations
In this section, we'll be discussing the following traditional methods for incorporating marketing considerations:
- Competitive comparisons
- Close ratios, retention ratios, growth
- Distributional analysis
- Dislocation analysis
Competitive Comparisons
Comparing your rates to your competitor's rates is a very obvious way of assessing your position within the marketplace and there are a few different formulas you can use for doing that:
You can do the comparison by overall rate or by individual segments. For example, if your overall average premium for personal auto is $450 and your competitor's $500, then:
- % competitive position = $450 / $500 = 90%
- $ competitive position = $450 - $500 = -$50
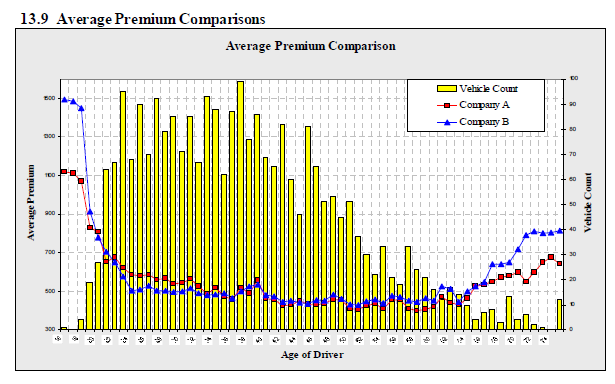
You can get information about your competitors from public rate filings but keep in mind that you will not have perfect information about their rates. The text has several graphs illustrating comparison to competitors. Here's one I thought was particularly interesting:
The ages along the horizontal axis are a little hard to read but you should notice that both companies have very similar average premiums for much of the middle age range. For insureds in the lower and upper age ranges however, company B is distinctly higher and there are several possible explanations. (For example, B may overpriced and A is correctly priced.) In any case, the difference in price points to an area where further analysis and action may be required. (Company B may decide to lower their prices in the lower and upper age ranges to become more competitive.)
Close Ratios, Retention Ratios, Growth
Close ratios and retention ratios were covered in Pricing - Chapter 1. You can find the formulas for those metrics on the page Formulas - Pricing. There is also a web-based problem in Chapter 1 -mini BattleQuiz 2
A new metric introduced in this chapter is:
This formula is very obvious. Even Ian-the-Intern could have figured it out. Most business like to grow but remember that with insurance, growth gives you an immediate benefit from the earned and written premium but the losses come later. It's very tempting to lower prices to spur growth only to find out later that subsequent losses can't be covered by the original premium.
Distributional Analysis
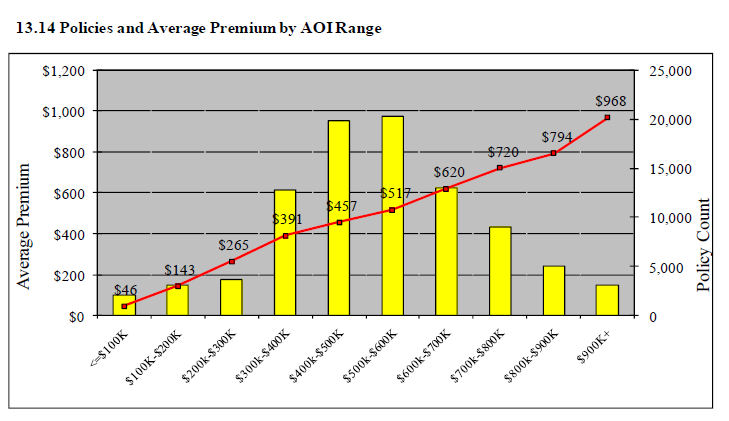
Werner uses the following graph to show how a distributional analysis can be used for marketing purposes:
These numbers aren't explicitly provided in the above graph, but let's suppose that 25% of homes in the general marketplace fall into the $500-600K category but only 20% of the company's portfolio have homes in that range. If this was the company's target, then there's no problem. But if the company had wanted to specialize in homes in that range, this distributional analysis indicates they are not meeting their target. There could be several reasons for the lower representation in that category:
- they are overpriced
- they have poor marketing for that segment of customers
- a competitor entered the market and the low percentage of insureds in the $500-600K range is a recent development
For the third item above, it may be helpful to also track changes in distribution over time. In any case, this distributional analysis provides information that a traditional rate indication does not.
Dislocation Analysis
Recall that one factor is determining an insured's propensity to renew their policy is the size of their individual rate change. A dislocation analysis quantifies the number of existing customers that will receive specific amounts of rate change. For example:
- 40% of insureds may receive no rate change
- 40% may receive a 5% increase
- 10% may receive a 10% increase
- 10% may receive a 25% increase
Those receiving no rate change are obviously more likely to renew while those receiving the 25% increase would be less likely to renew. Companies typically have a threshold defining the magnitude and dispersion of rate changes that the company believes will produce an unacceptable effect on retention. Given the above distribution, a company may decide to limit any individual rate change to something lower than 25% and possibly phase in the desired 25% increase over 2 renewal cycles instead of just one.
Just as a reminder, recall the non-pricing solutions for balancing the Fundamental Insurance Equation.
Systematic Techniques for Incorporating Marketing Considerations
Lifetime Value Analysis
Recall the assumption of standard ratemaking methods:
- all insureds will renew
This is such a bad assumption! Lifetime value analysis tries to improve on this by examining the profitability of an insured over a longer period of time taking into account that not all insureds will renew. Here we'll make the more realistic assumption that only a certain proportion of current customers will renew. This is the purpose of the persistency variable in the example below. (A more sophisticated model would also make assumptions about new business volume but this is not discussed in the text.)
Another difference between LVA (Lifetime Value Analysis) and traditional loss-cost ratemaking is that traditional ratemaking considers only premiums & losses for the period that rates will be in effect. LVA considers premiums & losses over the whole time the insured is a customer of the insurer.
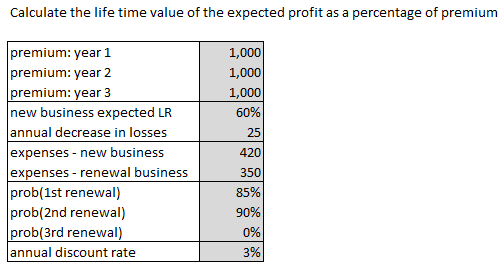
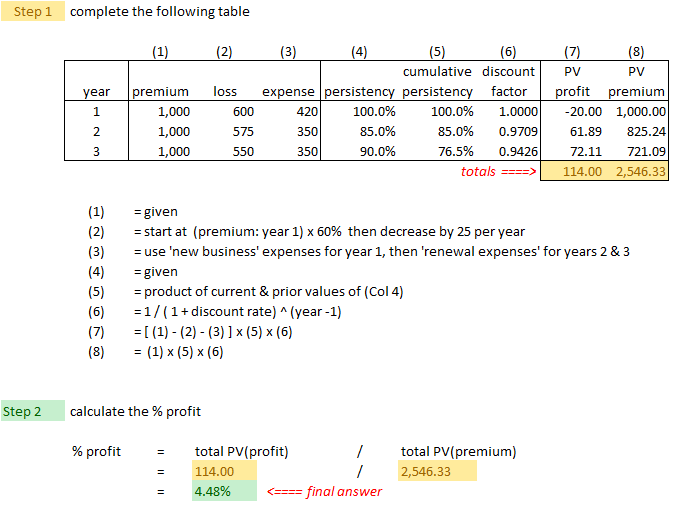
Alice is going present her own solution to the following exam problem:
- E (2013.Spring #10)
It's very similar to the example in the text, if you care to look, but the format of the given information in the exam problem is probably closer to what you'll actually see on the real exam. It's a fairly easy problem but here are few tips:
- The premium the insured is charged for year 1 is $1,000. This can change in years 2 & 3 due to rate changes but in this problem, the rate stays at $1,000 for all 3 years.
- The loss for the first year is the given loss of 60% ratio multiplied by the $1,000 premium, which is $600. This does change in years 2 & 3. The loss goes down by $25 per year because renewal business is usually more profitable than new business. (Insurers like to get rid of bad risks on renewal.)
- The fixed expenses are higher for year 1 then lower for year 2 & 3.
- The persistency is calculated using the probability of renewal. Formulas for this are given in the solution. Note the difference between 'persistency', which is a value for one individual year, and 'cumulative persistency', which considers the current and all prior renewal probabilities simultaneously.
- → year 1 always has a persistency of 100%
- → the probability of 1st renewal applies to year 2 (so be careful when you're filling the rows of the table.)
- → the probability of 2nd renewal applies to year 3
- → the probability of 3rd renewal applies to year 4, and since it's 0% we don't need a 4th row in the table
- The last 2 columns in the solution show the present value of premium and present value of profit. These are the key values.
| Here's the problem... |
| And here's the solution... |
| And here are some similar practice problems... |
Optimized Pricing
This section is a very high level overview of the method of optimized pricing.
Question: what is optimized pricing
- Optimized pricing is a pricing method that combines loss costs and customer demand to develop rates that meet volume and profitability goals.
The loss costs portion is just traditional ratemaking. The customer demand portion refers to conversion and retention considerations:
- conversion = probability a customer will accept a quote
- retention = probability a customer will accept a renewal offer
Obviously, higher prices lead to lower conversion and retention percentages. You don't need a model to tell you that. The benefit of the models is that they quantify the change in conversion and retention for a given change in price. This helps you set the price at a level that will optimize profit. That's why it's called optimized pricing. :-)
Underwriting Cycles
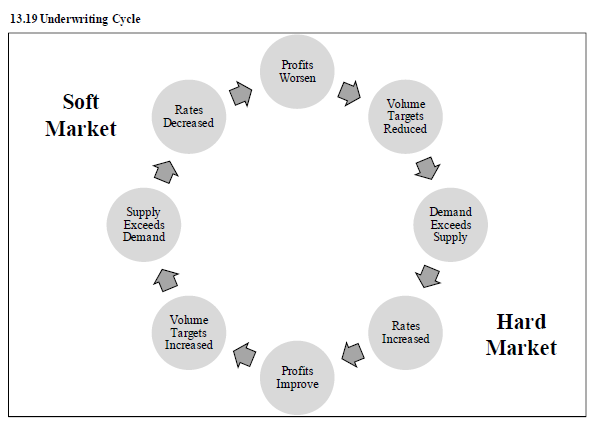
The insurance industry historically has cyclical results, like the graph of a sine curve. At the peak periods, there are higher prices and profitability. This is called a hard market. A hard market then gradually give way to periods of low prices and profitability. This is called a soft market. The soft market, through the sequence of steps shown below then redevelops into a hard market and the cylce continues. It's important to know where the industry is within this cycle.
You can remember the difference between hard and soft markets because hard markets have higher profitability. They both begin with "h". The diagram below explains the dynamics in 8 easy steps:
- In the circle at the top, we have the low point of the soft market (Profits Worsen). In the circle at the bottom we have the high point of the hard market (Profits Improve)
- The diagram shows 3 intermediate steps in moving between soft and hard markets, but I think the key step is the rate change.
- → When profits are low in the soft market, you increase rates to recoup losses.
- → When profits are high in the hard market, you've got room to decrease rates to increase market share.
Remaining Exam Problems
POP QUIZ ANSWERS
Substitute p = 95% and k = 10% into this formula:
- E(Y) = (1.96 / 0.10)2 = 384
